Section E. The Basics of Flood Risk

How are flood maps used?
- Community officials use flood maps to understand and communicate local flood risk, manage floodplains and require new and substantially improved buildings to be built in ways that mitigate losses from future floods.
- Emergency management officials use flood maps to plan evacuations and access for search and rescue.
- Mortgage lenders use them to help determine flood risk and decide whether to require flood insurance as a requirement for loans on buildings in floodplains.
- Insurance professionals use the maps to determine the flood risk and insurance costs for buildings in floodplains.
- Developers and builders use them as part of location siting and design and construction decisions.
- Residents and business owners use flood maps to learn about flood risk as they purchase property and investigate how best to protect their property from physical damage and financial costs of flooding.
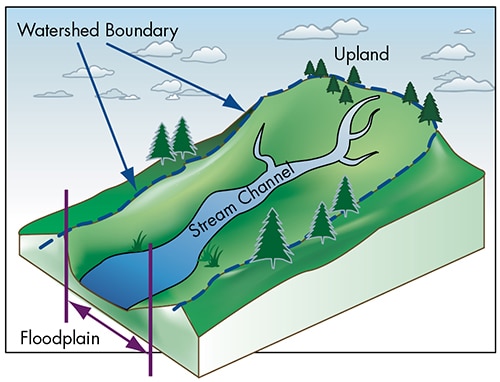
Every body of water, from the smallest creek to the largest ocean, has a floodplain around it. Simply put, the floodplain is the normally dry land area that is susceptible to inundation when water levels rise higher than normal. Floods can vary in size and how often they occur. Engineers use various methods to analyze these two factors, also called magnitude and frequency, to determine an area's overall probability of flooding.
The flood risk information is then put in a map format that is more easily used by communities as they apply floodplain management regulations and make decisions. Flood risk information and maps are also used by property owners, developers, builders, engineers and architects who are planning how and where to build or improve structures and how to undertake development other than buildings.
The most widely available formats used to convey flood risk information are Flood Insurance Studies and Flood Insurance Rate Maps (FIRMs) developed by FEMA when communities are identified as prone to flooding. FIRMs show areas that are expected to be flooded by the level of flooding that has a 1 percent chance of being equaled or exceeded in any given year. Flood Insurance Studies include summaries of the nature of flooding, historic floods, flood sources studied, and engineering and mapping methods used. Studies also include more detail on flood elevations than shown on FIRMs.
Among other information about communities, FIRMs depict the 1-percent annual chance flood (called the "base flood," see Question 25 for more detail), which is an important concept to understand. Question 2 describes how you can access FEMA's studies and maps online to learn more about your community's flood risk.
25. What is the base flood and why does FEMA use it for mapping?
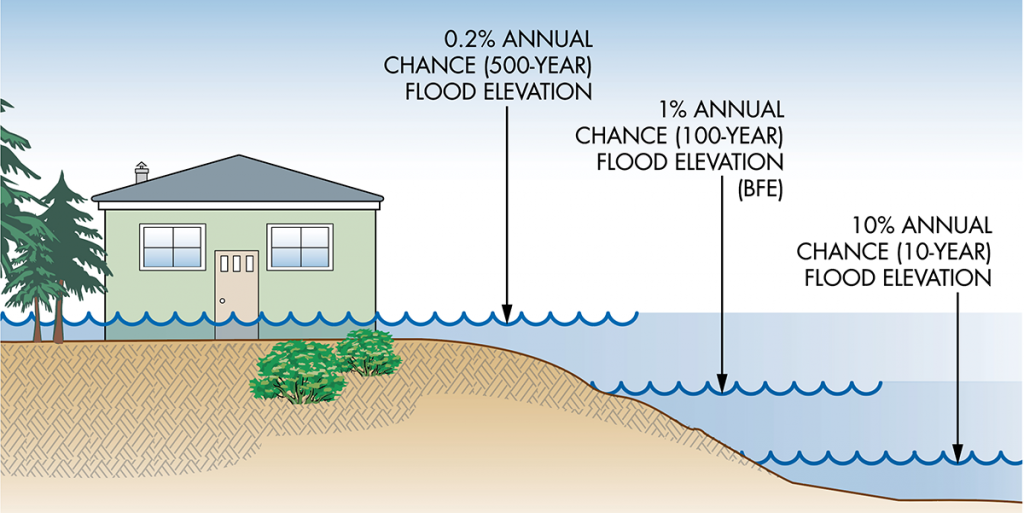
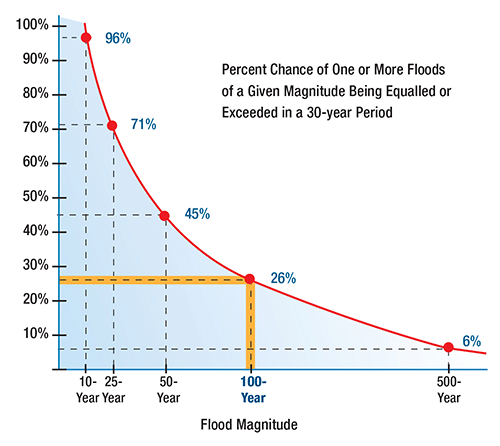
The "base flood" refers to the level of flooding that has a 1 percent chance of being equaled or exceeded in any given year. The 1-percent standard is a probability statement – larger floods can and do occur somewhere in the U.S. every year. Just because a specific location hasn't flooded in many years (or has experienced multiple floods) doesn't change the probability of further occurrence.

Base flood = 1-percent annual chance flood = 100-year flood*
* Although common, the term "100-year flood" should not be used. It is widely misinterpreted to mean "once every 100 years," which is incorrect and misleading. The base flood is a statement of probability of occurrence in any given year.
In developing the concepts behind the NFIP, the 1-percent standard was selected as a compromise between legislative and administrative decision makers and the regulated public. It was never envisioned as optimal by those who proposed and implemented it. Delineating areas subject to a shallower and more frequent flood (such as the 10-percent annual chance flood), would result in excessive exposure to flood risk, while regulating to a more severe and less infrequent flood (say, a 0.1-percent annual chance (1000-year) flood), was considered an excessive standard for design purposes for non-critical development.
FEMA's use of the base flood to delineate areas prone to flooding and to regulate development in those areas should be viewed as a minimum. If your community is aware of factors that increase flood risk, or has experienced flooding that demonstrates that using the base flood elevation is not adequate to protect people and property, elected officials have a responsibility to explore standards that provide a higher level of protection (described in Section H).
26. How does FEMA determine the base flood and how are flood maps prepared?
FEMA uses widely accepted engineering methods and models to determine the base flood along waterways and shorelines and to estimate how high base flood elevations will be. These same methods and models are used by other federal, state and local government agencies, as well as by developers, and are based on sound scientific principles. Past flooding and rainfall events are only some of the elements used in these analyses. FEMA then uses the results of the analyses to draw FIRMs. Having high-quality topographic data that shows the shape of the land is important.
During FEMA's mapping and map-revision processes, communities are invited to contribute local information. Communities and the public are also offered opportunities to comment on the results before FEMA finalizes and issues studies and maps.
Community officials and citizens should look beyond using FIRMs as the only sources of flood risk information. Regardless of the methods and models used, the FIRMs have limitations. For example:
- Each flood map is a "snap shot" representation of risk at the time the flood study was prepared, and does not take into account future effects of urbanization and development, sea level rise, climate change and other factors that will likely increase future flooding.
- Flood maps do not depict all flood risk aspects, such as how rapidly flood conditions may occur (flash flooding), which areas have dangerously fast-flowing floodwater, areas where floodwaters remain high for days or weeks, areas subject to erosion and scour, or what hazards may be present in the floodwater (pollution and debris).
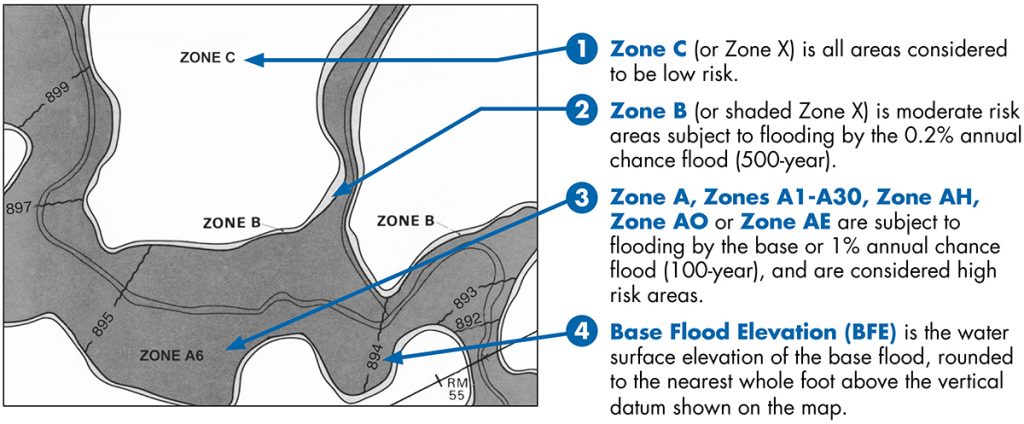
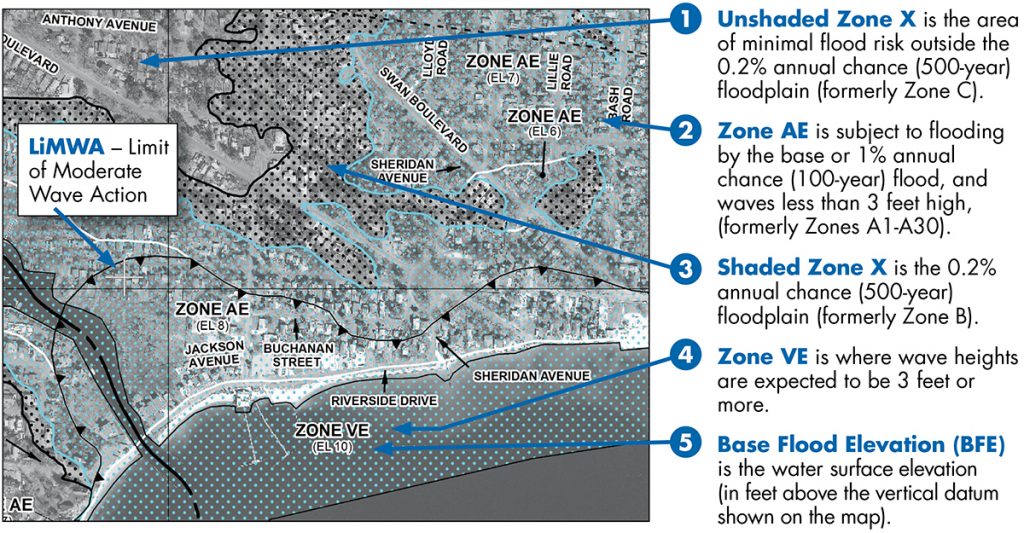
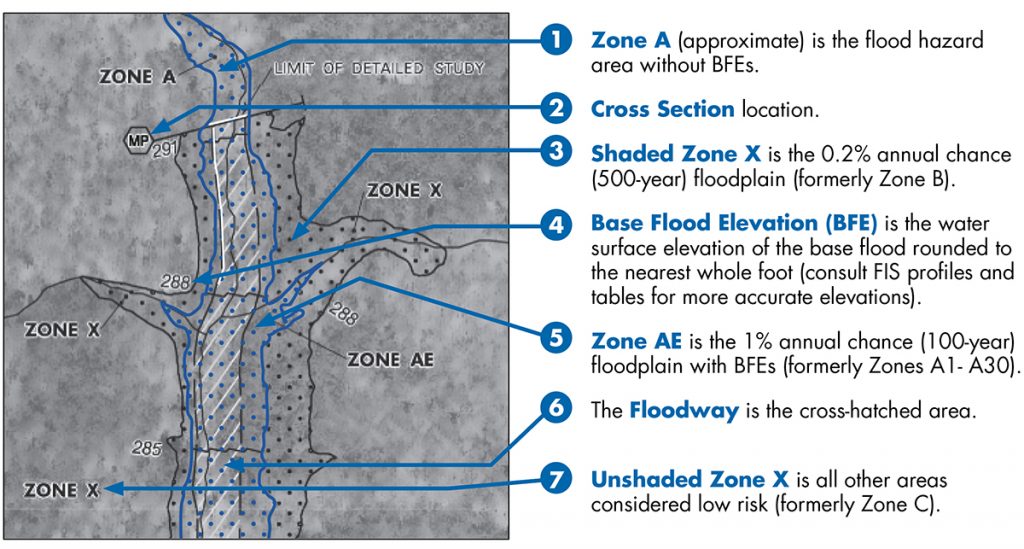
The appearance of FIRMs and flood zones has changed over the years since FEMA began publishing studies and maps. Early maps (sample shown below) are still the only maps available for many communities, especially in rural areas. Those maps were paper products that made it difficult to translate flood zone boundaries and flood elevations onto other maps, such as site plans and subdivision plats. Most early maps were drawn on topographic maps without sufficient detail, including U.S. Geological Survey maps with 20-foot contour intervals. More recent maps use digital technology, aerial photography and detailed topographic mapping. Examples are shown below.
27. If an area isn't shown on a FIRM as a special flood hazard area, does that mean there is no flood risk?
No. Any low-lying area close to a body of water has a risk of flooding. But, given budget limitations, many flood-prone areas are not shown on FIRMs, especially those that have poor drainage and are not directly associated with a body of water. FEMA's data show nearly 25 percent of all claims are paid for flood damage to buildings in areas outside of special flood hazard areas. These areas are labeled Zone X (or Zone B/C) on FIRMs and sometimes are called "low risk" floodplains to indicate there is a chance of flooding.
Additionally, from the beginning of the NFIP, FEMA has focused mapping and map revision efforts in urbanized areas and communities where development and growth were anticipated when flood studies were first started. Only about 40 percent of the nation's floodplains have been mapped. This means there are many flood-prone areas not shown on FIRMs. FEMA typically does not study the following:
- Rural watersheds
- Streams with a contributing drainage area of less than 1 square mile
- Local drainage problems not associated with a body of water, usually associated with increasing rainfall runoff in urban areas
- Areas downstream of dams or landward of levees that could be flooded if those flood control structures fail
Local flood studies and maps supplement FEMA maps.
The NFIP regulations specifically acknowledge that communities may have local studies and maps showing flood prone areas not shown on FIRMs. These studies can be adopted and locally delineated flood prone areas can be regulated along with SFHAs.
28. Why is it important for us to consider how flood risk may change in the future?
Flood risk is not static – it changes constantly due to development, erosion, land use changes, subsidence of the land, changes in rainfall patterns, sea level rise, and other factors. This can be difficult to understand because flood maps with "precise" floodplain boundaries and elevations give the impression that the lines are fixed and definitive. Community officials should keep in mind that flood risks are likely to change over time, which means buildings designed to comply with today's minimum requirements will likely be subject to future flooding. It's a good idea to plan for this by strengthening these requirements for the future. Section H describes many ways communities can strengthen their local floodplain management programs.
How flood risks may change in the future differs depending on the source of flooding, whether rivers and streams or coastal shorelines.
Consider how future watershed development can increase flood risk along rivers and streams.
Floodplain mapping that considers the ultimate watershed build-out condition is one scientific tool that can be used to set regulations and development guidelines so that other properties are not affected by proposed development. Charlotte-Mecklenburg, NC took this proactive approach by considering full build out conditions and land use within and outside the floodplain to identify the cumulative impacts of development. The results showed flood levels in some areas could increase 2-9 feet at full development.
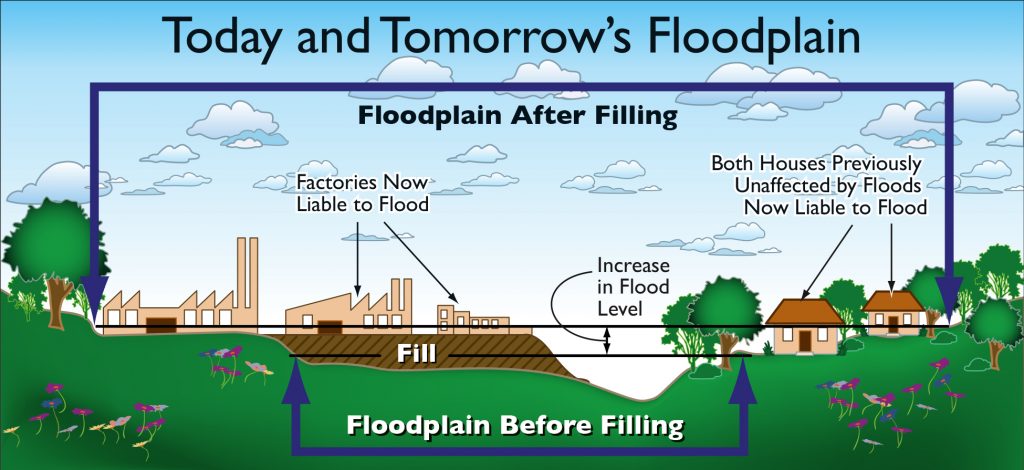
Rivers and Streams. Most inland communities with rivers and streams are aware of the effects of upland development. More impervious surfaces (roofs, parking lots, streets and roadways) mean more rainfall runs off of the land, accumulating in waterways and overflowing into floodplains, usually resulting in deeper flooding (see graphic). Changes in drainage patterns that usually go along with development (gutters, ditches and piped storm drains), can shorten the time it takes for runoff to reach streams. Even in areas where on-site management of stormwater runoff is mandated, stormwater ponds and other features aren't designed to handle the extreme rainfall amounts experienced in many areas that can produce damaging floods.
Many inland communities also are experiencing effects of climate change, including more intense storms with high rainfall amounts that occur over shorter periods of time, reducing the amount of rain that soaks in. Some studies suggest precipitation patterns are changing, with wet areas becoming even wetter, dry areas even dryer, and most studies concluding there will be an increase in the number of "extreme" events.
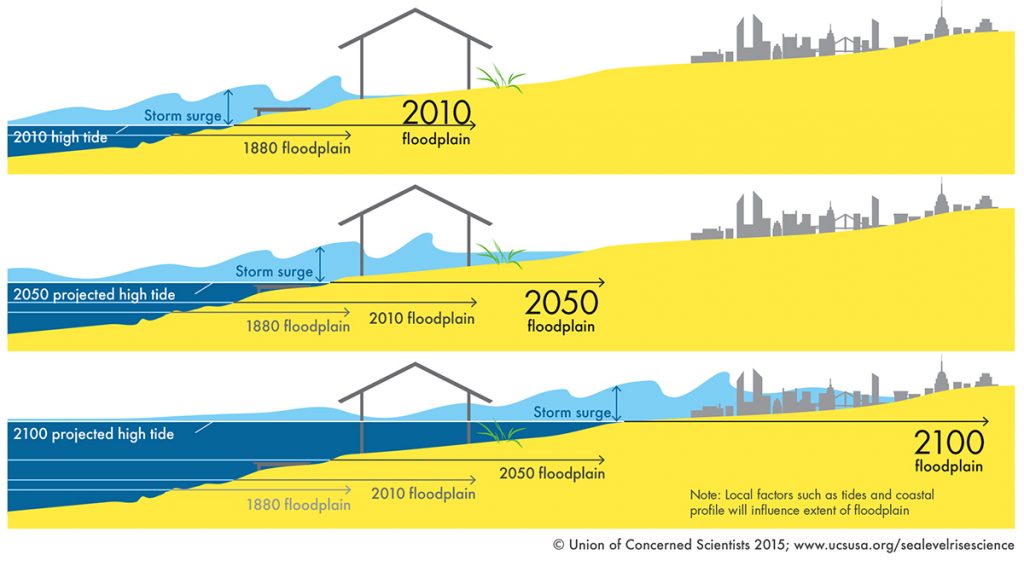
Coastal Shorelines. A large percentage of the U.S. population lives in counties and municipalities with an Atlantic, Pacific, Gulf Coast or estuary shoreline. Numerous population projections indicate that the number of people in those areas will continue to increase. Scientific findings estimate sea level may rise from 1.5 to nearly 10 feet at various coastal locations in this century. Rises in sea level will magnify the risks of storm surge and high-tide flooding (see graphic). Many coastal communities already experience road flooding during normal high tides when rainfall runoff cannot drain away. In some areas, subsidence (sinking of the land) exacerbates the flooding effects of sea level rise. More pertinent to increasing flood risk associated with climate change and sea level rise is how many people live on low-lying land. One analysis indicates that nearly 5 million Americans live on land that is within 4 feet of the local high tide level.

Success Story Connection
Sea level is rising at twice the global average rate in Norfolk, Virginia. In response, the city has completed dozens of living shoreline projects to protect vulnerable coastal areas.
Many coastal urban communities already deal with more frequent occurrences of high-tide flooding, sometimes called "nuisance flooding," or "sunny day flooding" due to sea level rise, when even slightly higher than normal tides impede the drainage of stormwater runoff. The resulting inundation of low-lying roads, utilities and buildings can depress property values, speed deterioration of utilities and slow the economy when employees can't get to work.
Storm surge and high tides magnify the risks of local sea level rise. As local sea level rises, coastal storm surges penetrate further inland. The extent of increased flooding at any given location will depend on several factors, including contours of the land.